AI agents that coordinate across cell sites to optimize radio network performance
Telecommunications·Multi-Agent RL
Network optimization is a coordination problem.
Every network optimization initiative requires coordinating dozens of cells simultaneously. Most of the tools and processes in the industry treats cells as independent, but what one cell does affects every cell around it.
Cell Outage Compensation
A site goes down — hardware failure, power loss, fiber cut. The cells around it are still running with tilt configurations optimized for a world where that site exists. Traffic floods into Tier 1 neighbors, which weren't tilted to cover that area, creating dead zones and overloaded cells simultaneously. The RF team manually adjusts neighbors one at a time, often making Tier 2 problems worse. Hours pass. When the site comes back up, nobody reverts the temporary changes cleanly.
Event-Driven Congestion
A stadium fills up, a festival starts, a protest forms. Tens of thousands of devices concentrate in an area normally served by a handful of cells. The cells covering the event choke while surrounding cells sit underutilized. The optimal configuration isn't just "tilt toward the crowd" — it's a coordinated re-balancing across the entire surrounding cluster so that capacity shifts without creating coverage holes elsewhere.
Steady-State Drift
Even under normal conditions, most networks run on configurations set during initial deployment and tuned sporadically since. Traffic patterns shift — new buildings go up, a shopping center opens, work-from-home changes commute flows — but tilt configurations don't follow. The result is chronic inefficiency: some cells overloaded, others underutilized, coverage gaps that persist for months because fixing them means coordinating changes across multiple sites and nobody has time.
All three are the same underlying problem. The network is a coupled system — what one cell does affects every cell around it — but every tool and process in the industry treats cells as independent.
Every cell in the network operates as an autonomous AI agent.
The approach is based on Deep Coordination Graphs paper (Böhmer et al., ICML 2020) — a multi-agent reinforcement learning framework where agents are connected through a graph structure that mirrors the network's interference and neighboring relationships.
Each agent learns two things: the value of its own actions in isolation (a utility function), and the joint value of its actions combined with each neighbor's (a payoff function). When the system needs to act, it runs message passing across the coordination graph to find the joint configuration that maximizes the global objective — not just what's best for any single cell, but what's best for the cluster as a whole.
Each agent observes its own performance state — coverage quality across its serving area, downlink throughput, CQI distribution, PRB utilization, load — along with spatial context from a geographic coverage model built on real terrain and building data.
This maps directly to the three scenarios. A cell goes down — the system re-optimizes the entire surrounding cluster in one pass. A congestion event hits — the system shifts capacity toward the hotspot while rebalancing the rest of the cluster. Under normal conditions — it finds the configuration that no human team would arrive at manually, because it evaluates all cells together instead of one at a time.
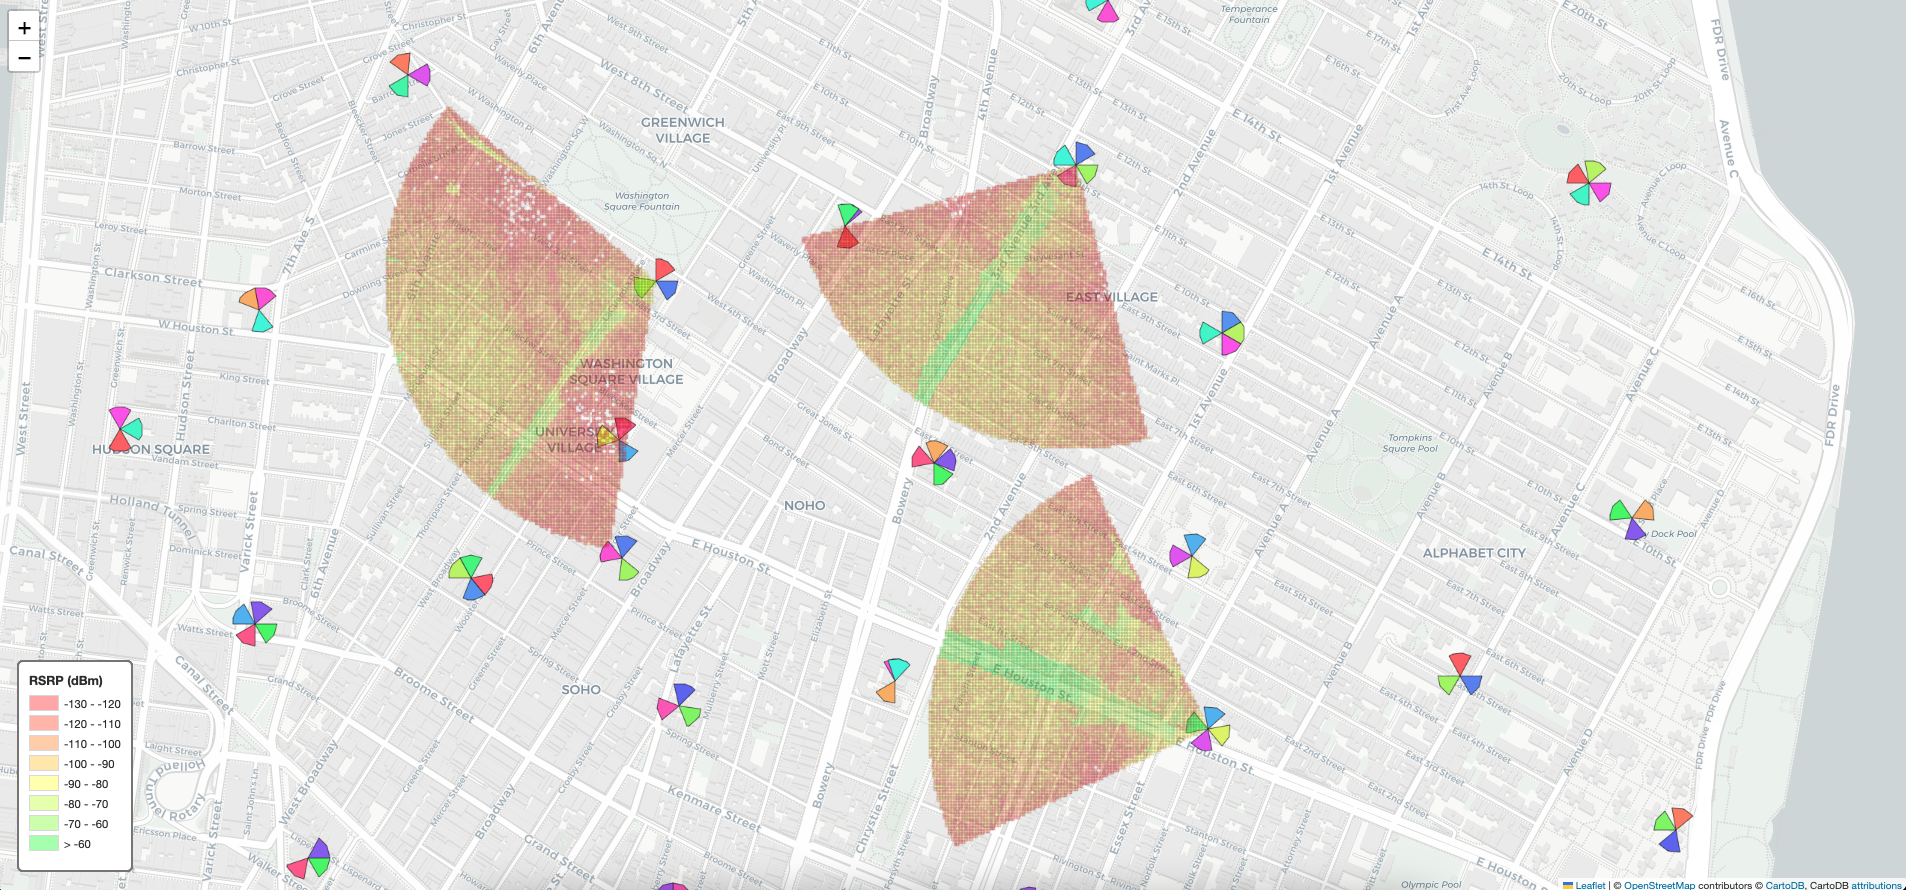
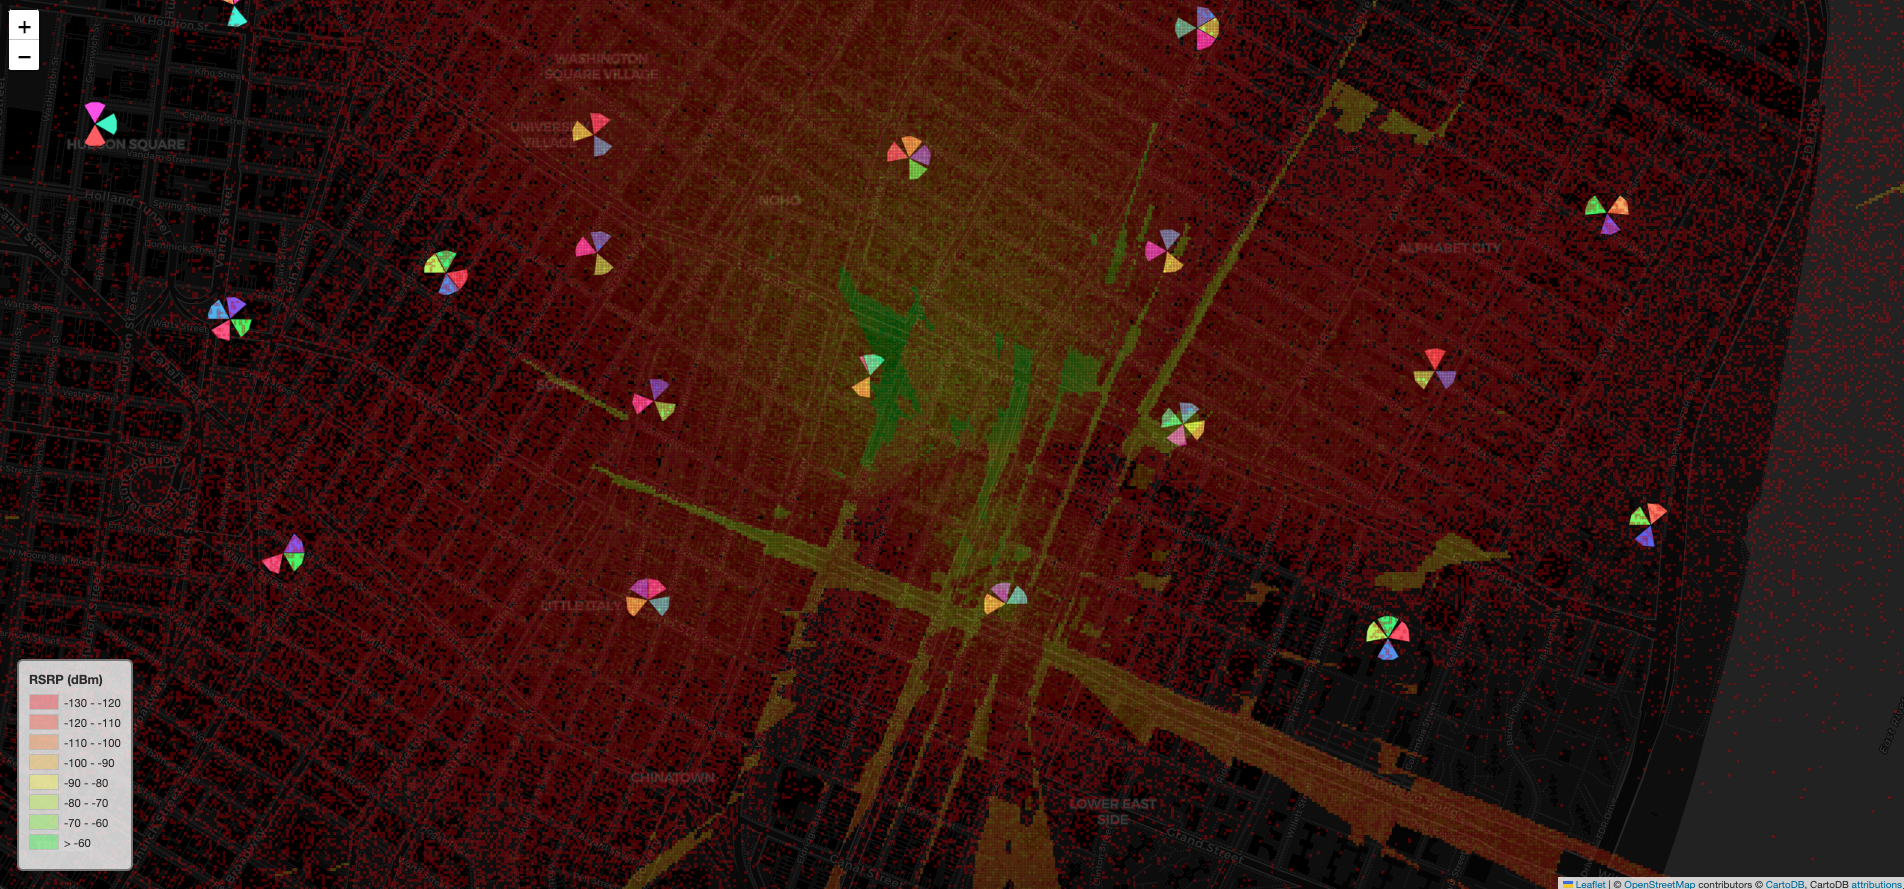
Multi-cell coverage analysis — each agent observes its coverage quality and coordinates with neighbors across the cluster
Three objectives that fundamentally conflict with each other.
Coverage
Measured as the RSRP distribution across each cell's assigned geographic area. Not average RSRP — the actual distribution, with particular attention to the lower percentiles. A cell with great average signal but 30% of its area below usable thresholds is failing its users.
Throughput
Downlink throughput per cell, capturing whether the network is actually delivering data. Weighted on a log scale — the improvement from 1 Mbps to 10 Mbps matters far more than from 100 to 110.
Load Distribution
How evenly demand is spread across cells. Some cells choking at 95% utilization while neighbors sit at 20% means users are getting degraded service that a better tilt configuration could fix.
Push coverage wider and you increase interference, which kills throughput. Tighten coverage to reduce interference and you create dead zones. Shift load toward underutilized cells and you may degrade their coverage quality. The system learns to navigate these tradeoffs jointly rather than chasing any single metric.
Initial training happens entirely in simulation.
We built a full system-level network simulator — real terrain elevation, real building footprints, 3GPP-standard propagation models, user mobility, and resource scheduling down to the PRB level. The simulator calculates cells KPIs and counters based on traffic profiles, network configuration, and cells Remote Electrical Tilts values.
Our AI engine is trained using the Electrical Tilt values, the cells KPIs and counters as input, while optimizing towards the combined objective of coverage, throughput and load.
Inference can run against either the simulator (for planning and what-if scenarios) or real network KPI feeds (for live optimization). An operator can train on a digital twin of their network, validate recommendations in simulation, and then point the same system at live data with no retraining.
What made this hard.
Balancing competing objectives
We spent significant time on reward design to produce configurations that a senior RF engineer would look at and agree are sensible, rather than configurations that game a single metric. The reward needed to capture not just what each cell achieves individually (coverage), but what neighboring cells achieve together (throughput under shared interference, load across shared coverage boundaries).
Scenario generalization
The system needs to perform well under normal load, under outage conditions, and under extreme congestion — three very different operating regimes. A model trained only on steady-state traffic won't know what to do when a site drops. Training across diverse scenarios was essential for producing agents that adapt rather than memorize.
Simulator accuracy
Reframe around the core problem being simulation fidelity — open-source building data has gaps, propagation models are statistical approximations — and the solution being digital twin development. A high-fidelity digital twin of the operator's network, calibrated against real drive-test and KPI data, closes the sim-reality gap and lets the AI engine train on conditions that match production.
Validated in simulation against real network geometry.
In simulation, the agents learned coordinated tilt configurations that improved composite network performance over the manually-tuned baseline, converging to stable configurations that balanced coverage and capacity: high-site cells downtilted to contain their interference footprint, gap cells uptilted to extend reach, and — critically — both happening in concert rather than producing the oscillation cycles that sequential manual tuning creates.
The simulation environment was built from real cell deployment data — actual site locations, antenna patterns, and terrain — making the geometry of the optimization problem realistic even though the radio behavior was modeled, not measured. The inference architecture was designed to connect to either the simulator or a live NMS feed without changing the models, so the path from proof-of-concept to production integration is a deployment question, not a research one.
What the work demonstrates is a working multi-agent decision engine that converges to coordinated tilt configurations on a realistic network topology — and does it without the oscillation cycles that plague sequential manual tuning. The hard part — getting agents to cooperate on a high-dimensional, conflict-prone optimization without thrashing — is solved. The system is ready for field validation on a live network.